How to create a free Google Sheets CRM template
This blog tutorial series is going to look at how to make a fully customizable CRM template with Google Sheets. The main benefits of using Google Sheets as a CRM is that Google Sheets has some inbuilt advantages like good accessibility, real-time collaboration, simple to use, and integration with third party apps that make it a good choice. After the tutorial, you will know how to create a Google Sheets CRM template that does contact and account management, and easily tracks deal stages for different people in your sales team. In the end we will also create a few Google Sheets CRM templates as an example, which you can use to get started.
Google Sheets CRM template tutorial series:
- How to create a free Google Sheets CRM template
- Google Sheets CRM template tutorial
- Google Sheets CRM examples
We are assuming that you are looking for a simple CRM, and is intended to be used by you or a small team. If you are looking to scale, or looking to track a large number of contacts, a specialised CRM software would be better.
Download the Google Sheets CRM template
Getting familiar with Google Sheets Essentials:
Before we get started on the CRM, we need to get familiar with a few key essentials of Google Sheets which is critical in creating and using a CRM effectively. If you are an advanced user, feel free to skip this section and move on to the next.
- Creating a new sheet: Just enter sheets.new or into Google or Safari or any browser and it should take you to a page with a new Google Spreadsheet.
- Adding multiple sheets to the same Google spreadsheet: To add multiple sheets, click on the + icon at the bottom of the Google spreadsheet. This will create a new sheet in the same spreadsheet.

- Accessing a saved spreadsheet from Google Drive: Go to your Google Drives folder, and click on the saved spreadsheet.
- Changing default currency: By default the currency used and format used in a Google Sheets is USD. If you want to change this to GBP, or Euros, or Rupees, you can change this by going to File -> Settings -> General -> Locale and selecting a different region. The date, time, currency, numbers format will all change to the region format.

Important things we need to track in the CRM template:
First, we are going to look at building a really simple CRM. Once we have a working CRM, we can look to adding more features. This allows us to get something that works fast - instead of being in planning stage with too many features. Let's start with creating separate sheets for modules that should be present in any CRM. Any CRM should have one sheet which allows you to add your team mates, one for assigning deal status and deal stages, one for managing all the deals, and one main dashboard to review and get progress updates.
Settings:
To start, let's create a sheet for team called "Settings". We'll keep this simple and just have a column for people in your team. I also added some basic formatting so that the title and header columns stands out. So, now we have an settings sheet which looks like this:

Deals:
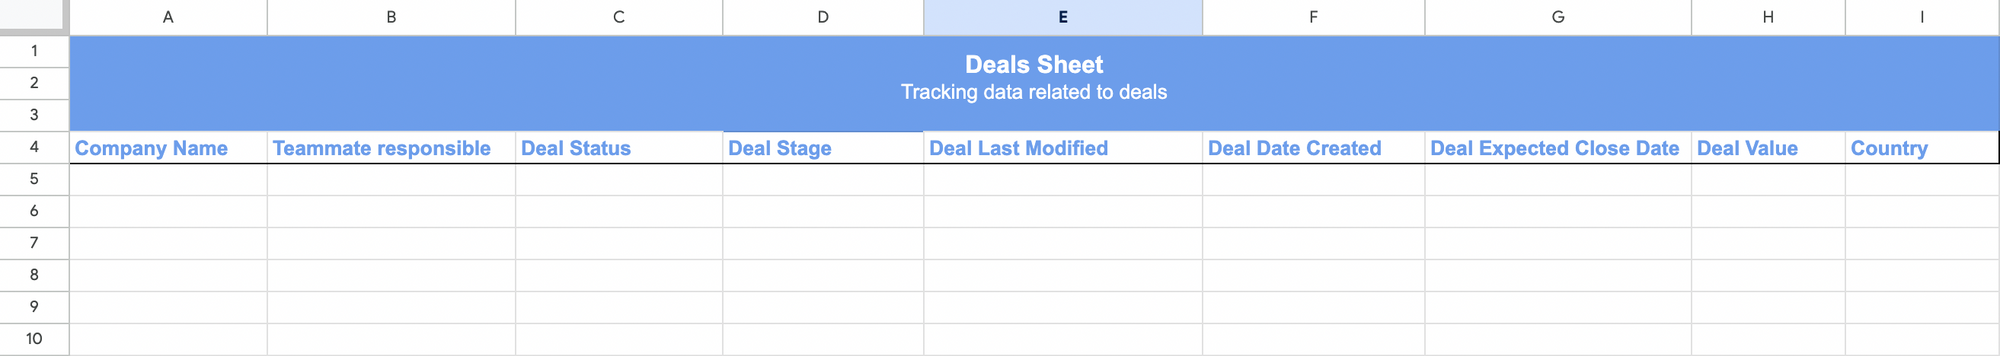
Next, let's create the "Deals" sheet. The deals sheet should allow someone to add a new company, assign the deal to someone in the team, add deal amount, expected deal close date, and other details about the deal.
I started by creating these empty columns on a new google spreadsheet. I also added some basic formatting so that the title and the headers for each column stands out. So, now we have an empty sheet which looks like this:
Dashboard:
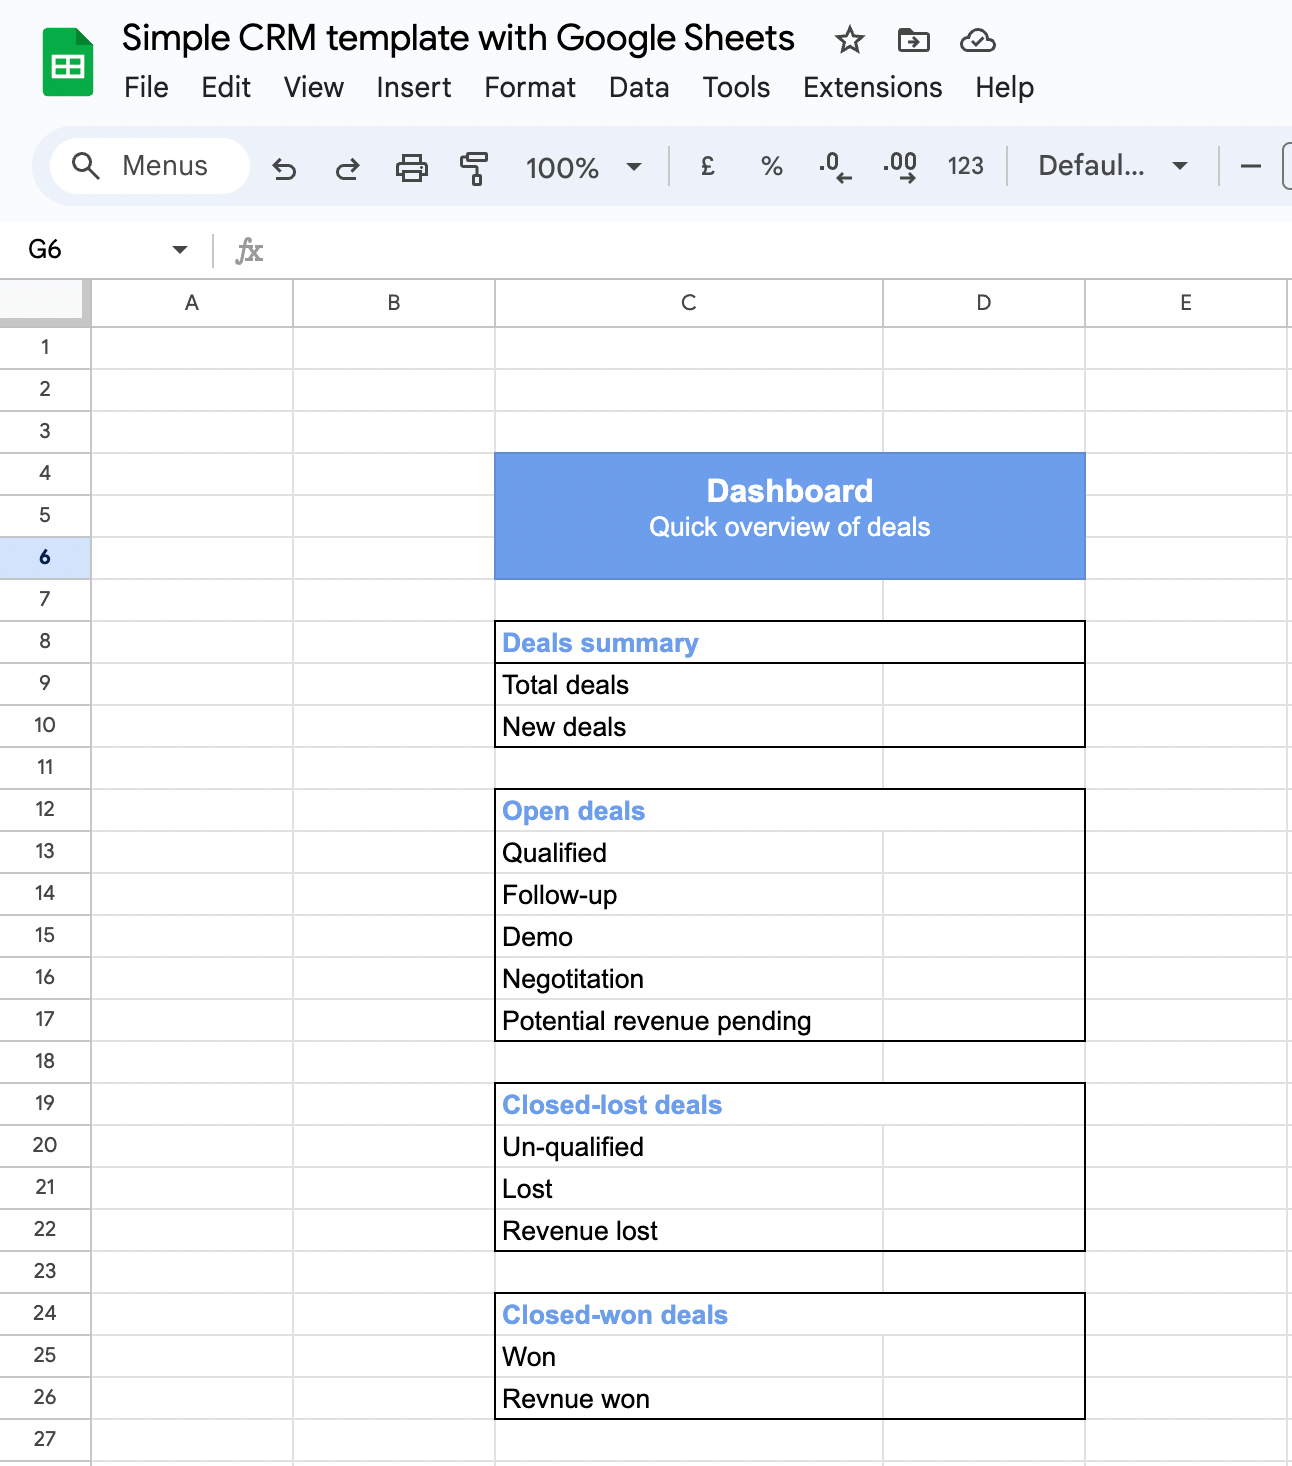
We also need to have a main dashboard sheet. The dashboard sheet will give me highlights about the deals in progress. For starters, I want to know more about how many deals are in progress, how many deals were created this month, how many deals are open, closed-won, and closed-lost, and the amounts related to each.
So, I created a new dashboard sheet for this which gives a quick overview of the deals and revenue.
So, in summary we should have 3 largely empty google sheets - one for settings, one for deals, and one for dashboards.

Improving the three settings, deals, and dashboard sheets:
The next step is to improve each of these sheets - we should be able to filter, sort by specific columns in these sheets easily. We also need to connect these three sheets together, so that data is displayed properly everywhere.
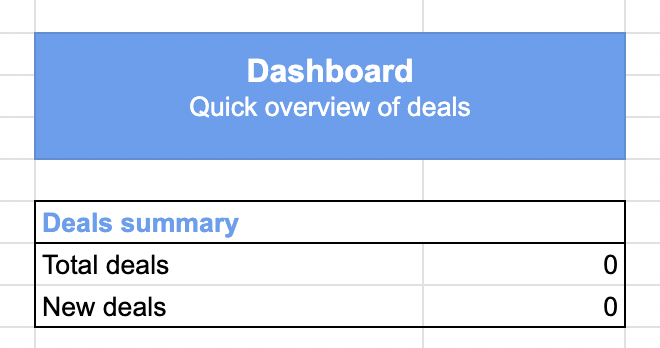
Connecting data between the three sheets: First, in the dashboards sheet - we have a 'Deals summary' section, which shows the total deals, and the new deals (i.e. deals created this month). Let's connect the sheets, so that this information is displayed properly.
To fill in the 'Total deals' on the 'Deals summary' dashboard, please enter this formula into the column:
COUNTA(Deals!A5:A100)
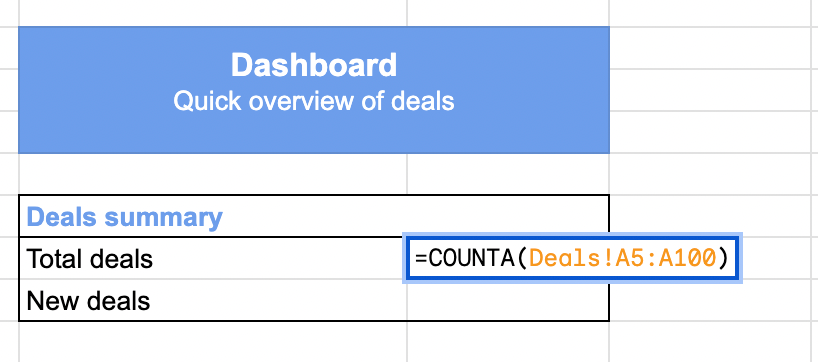
Here we are assuming that the deals sheet is named "Deals" - and then we are counting how many deals are present. So, when you enter the above formula, you will get the following result, which shows that the Total deals is 0. This is correct because we have not entered any information yet.

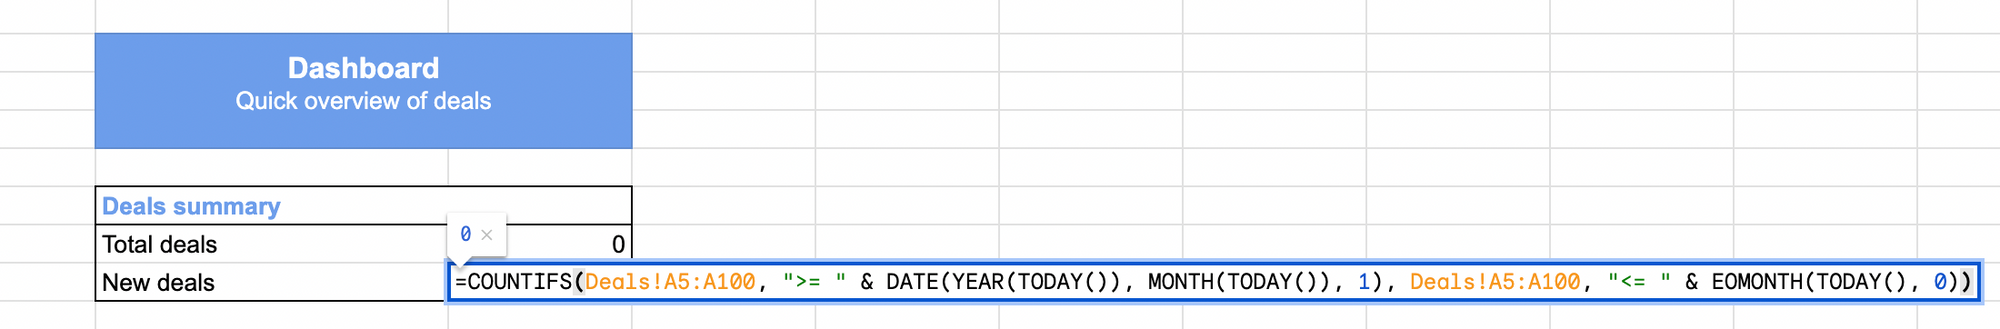
To fill in the 'New deals' on the 'Deals summary' dashboard, please enter this formula into the column:
=COUNTIFS(Deals!A5:A100, ">= " & DATE(YEAR(TODAY()), MONTH(TODAY()), 1), Deals!A5:A100, "<= " & EOMONTH(TODAY(), 0))
Breaking down the formula:
Deals!A5:A100: The range on the "Deals" sheet you want to analyze, extending it to 100 rows to account for growth.">= " & DATE(YEAR(TODAY()), MONTH(TODAY()), 1): The first condition checks that the "Created At" date is on or after the first day of the current month."<= " & EOMONTH(TODAY(), 0): The second condition checks that the "Created At" date is on or before the last day of the current month.
Again, we are assuming that the deals sheet is named "Deals", and then we are counting how many deals are created this month. This will again display as 0, as we have not entered any information yet.
Next, we need to see how many deals are in each stage. I will explain, how you customize these deal stages to your B2B needs later, but for now assume you have the following deal stages: Qualified, Follow-up, Demo, Negotiation, Un-qualified, Lost & Won. Each deal has to be in any one of these stages at all time. We are now going to count how many deals are in each of these stages, and display that information in the dashboard. For clarity, I have highlighted in yellow the columns we are trying to fill next.

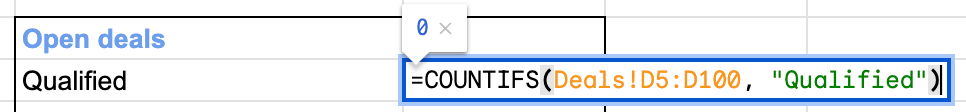
Add the following formulas to each of these columns. I have shown an example for "Qualified", but please do the same for all the other ones highlighted in yellow.
Formulas:
- Qualified:
=COUNTIFS(Deals!D5:D100, "Qualified") - Follow-up:
=COUNTIFS(Deals!D5:D100, "Follow-up") - Demo:
=COUNTIFS(Deals!D5:D100, "Demo") - Negotiation:
=COUNTIFS(Deals!D5:D100, "Negotiation") - Un-qualified:
=COUNTIFS(Deals!D5:D100, "Un-qualified") - Lost:
=COUNTIFS(Deals!D5:D100, "Lost") - Won:
=COUNTIFS(Deals!D5:D100, "Won")
Once you fill in the respective formulas to all the corresponding columns, you will see "0" displayed in all the highlighted columns because we have not yet entered any data in the deals sheet.
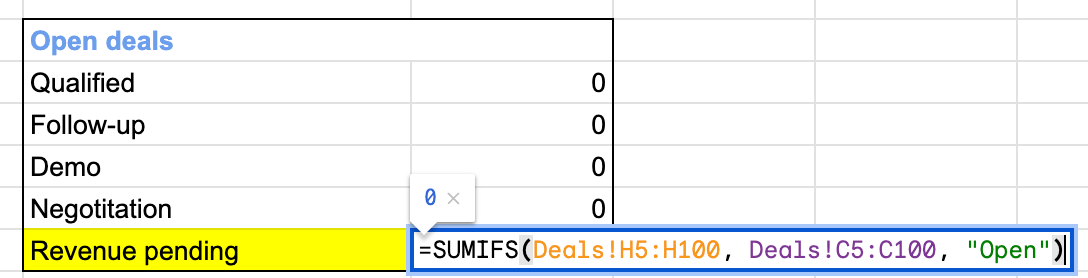
Next, let's write the formulas for displaying all the revenues. I have highlighted the columns we are trying to fill for revenues.
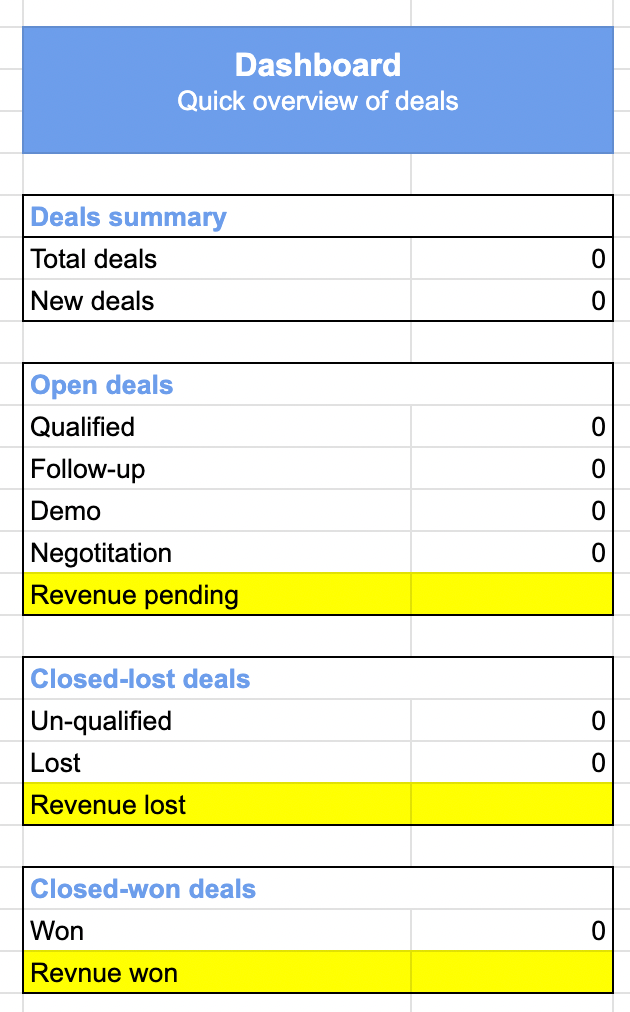
The Revenue pending should get a sum of all the deals that have a status of "Open"; the revenue lost should get a sum of all the deals that have a status of "Closed-lost", and the the revenue won should be a sum of all the deals that have a status of "Closed-won".
Below, I have shown the formula for revenue pending.

=SUMIFS(Deals!H5:H100, Deals!C5:C100, "Open")
In this formula:
Deals!H5:H100is the range containing the deal values you want to sum of all the open deals. Make sure that 'H' column in the deals sheet is related to deal value.Deals!C5:C1000is the range containing the deal status."Open"is the deal status we are interested in summing.
Similarly, add these two formulas in the "Revenue lost" and "Revenue won" columns.
Revenue lost: =SUMIFS(Deals!H5:H100, Deals!C5:C100, "Closed-lost")
Revenue won: =SUMIFS(Deals!H5:H100, Deals!C5:C100, "Closed-won")
We not have written the formulas for all the columns on the Dashboard sheet, and you should see something like this. It is correctly displaying "0" in all columns, because we have not yet entered any details in the "Deal" sheet.

That's it for this first part of the Google Sheets CRM tutorial. In this blog we looked at some Google sheet basics, and then created three sheets - settings, deals, and dashboard - and completed the dashboard sheet to show the total number of deals, plus revenues closed, won and pending.
In the next blog of this Google Sheets CRM tutorial, we are going to look at how we can add sort, filters to the deals columns, how to add dropdowns to the columns (i.e. in the "Deals" sheet we have a "Teammate responsible" column. This column should ideally be a dropdown, and we should be able to choose the team mate from a dropdown).